Designing a Unified Command Center for Property Operations
How I combined industry experience, human-led design decisions, and AI-assisted prototyping to explore a more efficient way to manage commercial properties.
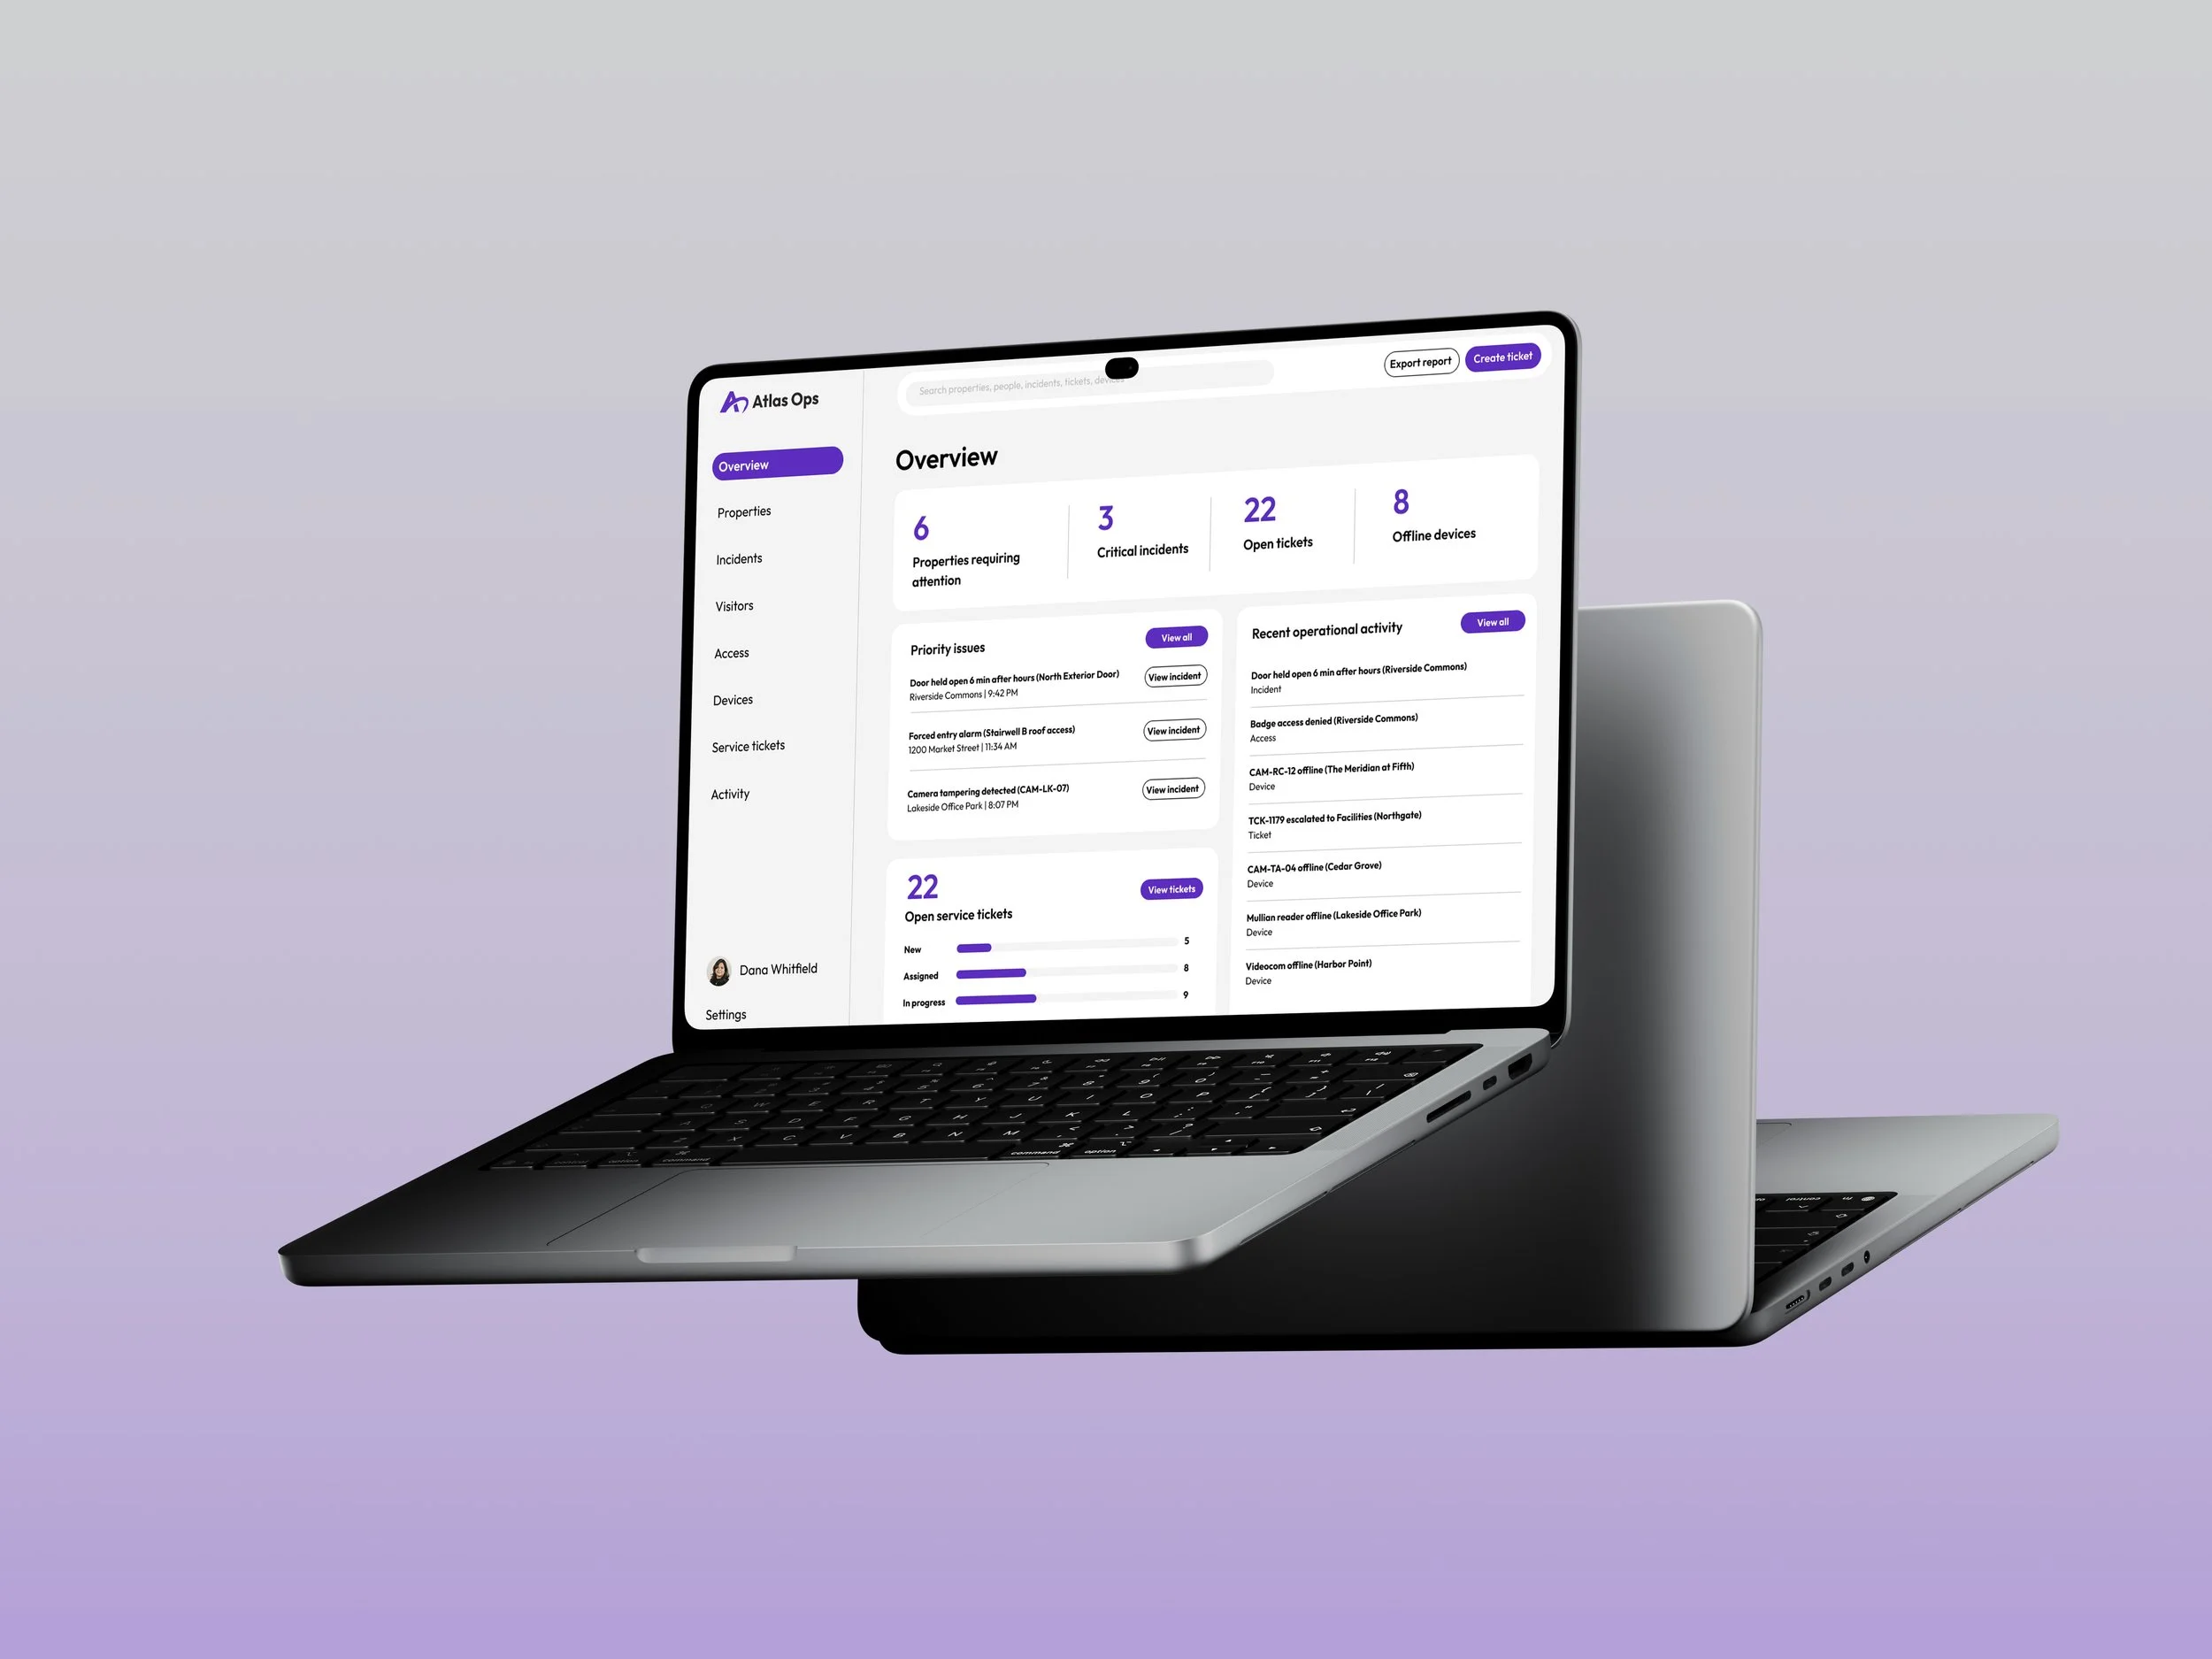
Overview
Atlas Ops is a conceptual SaaS platform designed to simplify commercial property operations. I designed a unified command center that brings building activity, security incidents, visitor management, and service requests into a single experience. The goal was to give property managers greater visibility across their portfolios, help them prioritize critical issues, and streamline everyday decision-making without switching between disconnected systems.
Role
Product Designer / UX/UI Designer
Tools
Figma, AI-Assisted workflows
Year
2026
Multiple systems. Disconnected workflows. Limited visibility.
Managing commercial properties often requires navigating multiple disconnected systems for access control, visitor activity, security incidents, and maintenance requests. This fragmentation creates operational blind spots, makes it harder to identify urgent issues, and can delay responses that directly impact tenant experiences.
The design challenge was to create a centralized experience that could serve two very different users: a regional manager overseeing dozens of properties and an on-site employee managing a single building, without overwhelming either with unnecessary complexity.
01 / Current state
Separate systems, each with its own view of the property
Visitor Management
Visitor arrivals and check-ins
Access Control
Credentials and door activity
Video Surveillance
Camera events and incidents
Service Tickets
Maintenance and work orders
All four systems lead separately to the Property Manager
Manual coordination across systems
02 / Proposed state
Related information and workflows in one interface
Atlas Ops
One connected operational view
- Visitors
- Access
- Video
- Service
- Identify
- Investigate
- Take Action
Design objectives
Visibility
Give users a clear picture of operational health across relevant properties.
Prioritization
Help users quickly identify the most important issues and next actions.
Actionability
Connect monitoring to incident resolution, visitor management, and service handoffs.
Translating Property Technology Experience Into Product Strategy
Working as an in-house Digital Designer at a PropTech company gave me exposure to the commercial property technology industry and the challenges of communicating complex security solutions. Through projects involving access control, video surveillance, and managed security, I developed a stronger understanding of how these technologies connect within a building's operational ecosystem.
I applied that industry context to Atlas Ops, using it to question the assumptions behind the initial design and establish more intentional priorities for the platform's navigation, information hierarchy, and workflows.
Different Responsibilities. Shared Platform.
Atlas Ops needed to support users operating at different scales, from regional managers overseeing entire portfolios to front-desk employees managing daily building activity.
Regional Property Manager
- Scope
- 35 properties
- Primary Need
- Portfolio visibility
- Key Tasks
- Triage incidents, monitor activity, escalate issues
- Interface Priority
- Exceptions and portfolio-wide trends
Front-Desk Employee
- Scope
- One property
- Primary Need
- Daily operations
- Key Tasks
- Manage visitors, check alerts, resolve immediate requests
- Interface Priority
- Specific tasks and immediate actions
Proposed role requirements informed by the project brief and industry experience; not validated through user interviews.
Design Principles
These differences shaped three principles that guided the platform’s information architecture and interaction design.
-
Surface What Matters
Prioritize critical incidents and exceptions over routine operational data.
-
Design for Responsibility
Adapt information hierarchy to each role while maintaining a consistent product experience.
-
Preserve Context
Keep relevant information accessible as users move between properties, incidents, and actions.
Moving From a Product Brief to an
Initial Interface
With the product brief established, I used Claude to accelerate the initial stages of interface exploration. Rather than building every foundational screen from scratch, I leveraged AI to generate early layouts, explore information architecture, and visualize potential workflows. This allowed me to quickly evaluate different approaches while maintaining control over the design direction. Claude served as a tool for exploration, not a substitute for understanding user needs or making informed design decisions.
Atlas Ops — UX Architecture, Low-Fidelity Wireframes & Design System Discovery
1. Your role
Act as a Principal Product Designer, UX Architect, and Design Systems Lead with experience designing complex B2B SaaS platforms, enterprise dashboards, and operational command centers.
Your job is to create a comprehensive, low-fidelity product experience for Atlas Ops, directly inside Figma. (Figma file: https://www.figma.com/design/tB1cq84lINFZkd8Ds1xh4y/Atlas-Ops?node-id=0-1&t=szV7WmEvxNZ44px2-1)
This is not a high-fidelity visual design exercise.
The primary objectives are to:
- Establish the information architecture of the product.
- Design the skeleton and layout of all essential application screens.
- Map the core user workflows and decisions.
- Identify recurring UI patterns and reusable components.
- Establish the foundations of a scalable design system.
- Identify the design tokens required to support the interface.
- Document interaction states, accessibility requirements, and edge cases.
- Connect the primary screens into a navigable, clickable prototype.
Important: Prioritize structure, consistency, usability, and functional clarity over visual aesthetics.
Do not generate polished mockups, marketing pages, brand illustrations, or elaborate color schemes.
Create actual editable Figma frames, components, and prototype connections using the available Figma integration. Do not substitute HTML mockups, screenshots, or a written specification for Figma objects. If direct Figma creation is unavailable, clearly explain the limitation and provide a Figma-ready implementation specification instead.
2. Company and product background
Company: Atlas Ops
Product category: Commercial property operations management
Company description:
Atlas Ops is a property-operations platform used by teams managing dozens of commercial buildings.
Property managers currently switch between separate systems for visitors, access control, video incidents, service tickets, and building activity.
Atlas Ops consolidates these operations into one unified command center.
The product should allow users to:
- Understand operational conditions across an entire property portfolio.
- Identify and prioritize urgent issues.
- Monitor individual buildings.
- Review incidents and determine appropriate next actions.
- Manage visitors, users, and access credentials.
- Monitor device health and availability.
- Create, assign, and escalate service tickets.
- Search across buildings, people, incidents, tickets, and devices.
- Take appropriate actions without needing expertise in the underlying technical systems.
The experience must support both portfolio-level decision-making and individual-building operations.
Primary users
Persona A — Regional Property Manager
- Oversees approximately 35 commercial properties.
- Frequently switches between buildings.
- Needs a portfolio-wide operational summary.
- Prioritizes unresolved incidents and service issues.
- Delegates tasks to local teams.
- Needs visibility into statuses, escalations, and outcomes.
- Typically works on a desktop.
- May have broader permissions across properties.
Persona B — Front Desk Employee
- Primarily manages one building.
- Checks visitors in and out.
- Responds to daily access and visitor issues.
- Needs simple, understandable interfaces.
- Performs repetitive operational tasks.
- Should not see unnecessary portfolio-wide complexity.
- Typically works on a desktop or tablet.
- Has restricted permissions for certain security and administrative actions.
UX principles
Design the product around these principles:
- Clarity over complexity: Translate technical events into actionable language.
- Action over observation: Every important alert should have a clear next step.
- Progressive disclosure: Show essential information first, with advanced details available when needed.
- Context preservation: Keep the user's selected property, filters, and workflow context when navigating.
- Consistency: Similar objects and actions should behave consistently across modules.
- Role awareness: Interfaces should adapt to user permissions and responsibilities.
- Operational trust: Clearly communicate data freshness, action status, failures, and uncertainty.
- Accessibility: Critical information must not rely exclusively on color, icons, or mouse interaction.
3. Figma file organization
Create a structured Figma file using the following pages:
| Page | Purpose |
|---|---|
| 00 — Product Architecture | Sitemap, role definitions, user flows, permission assumptions |
| 01 — Foundations & Tokens | Preliminary design variables and token architecture |
| 02 — Component Library | Reusable low-fidelity UI components |
| 03 — Portfolio Dashboard | Portfolio-wide command center |
| 04 — Property Detail | Individual building operations |
| 05 — Incidents & Alerts | Alert management and triage |
| 06 — Visitors | Visitor check-in and management |
| 07 — Access Management | Users, credentials, and permissions |
| 08 — Devices | Device inventory and health |
| 09 — Service Tickets | Ticket creation, handoff, and escalation |
| 10 — Search & Data Tables | Global search and advanced data management |
| 11 — States & Edge Cases | Loading, empty, errors, permissions, offline, confirmations |
| 12 — Responsive | Tablet and mobile adaptations |
| 13 — Prototype & UX Documentation | Prototype starting points, interaction notes, validation |
| 14 — Token Discovery Audit | Final token inventory, component usage, and design decisions |
Create the pages in this order.
Use consistent frame naming, layout rules, spacing conventions, and component instances across every page.
4. Wireframing rules
Visual fidelity
All initial screens must remain low fidelity.
Use:
- Grayscale only, with temporary neutral placeholder styling.
- Simple rectangular blocks and cards.
- Basic outlined icons or labeled icon placeholders.
- Minimal elevation.
- Realistic but fictional sample data.
- Simple typography hierarchy.
- Status labels that communicate meaning through text.
Avoid:
- Gradients.
- Decorative illustrations.
- Photography unless a labeled placeholder is necessary.
- Complex iconography.
- Finished brand colors.
- Excessive shadows.
- Detailed visual polish.
Layout
Use the following initial frames:
- Desktop: 1440px wide.
- Tablet: 1024px wide.
- Mobile: 390px wide.
Use Auto Layout wherever practical.
Establish consistent layout rules for:
- Global navigation.
- Header.
- Page title and supporting information.
- Search and filtering.
- Content regions.
- Data tables.
- Cards.
- Side panels.
- Drawers.
- Dialogs.
- Sticky action areas.
Use reusable layout components rather than manually recreating the same structure.
Content
Use realistic fictional data.
The example portfolio should contain 35 properties.
Include believable operational data across buildings, including:
- Open incidents.
- Security alerts.
- Visitors awaiting check-in.
- Access-denied events.
- Offline security cameras.
- Unavailable access-control devices.
- Maintenance requests.
- Unassigned service tickets.
- Escalated issues.
Make content realistic enough to reveal layout challenges, especially long names, unusual statuses, large numbers, and dense tables.
5. Core product screens and workflows
Build the following experiences. Create enough frames to communicate the workflow, state transitions, and reusable UI patterns.
A. Portfolio Overview Dashboard
Primary persona: Regional Property Manager
Create a portfolio-wide command center.
Required sections
- Global navigation.
- Portfolio/property selector.
- Search.
- Notifications.
- User profile.
- Summary KPI cards.
- Priority issues.
- Properties requiring attention.
- Portfolio-wide property health.
- Recent operational activity.
- Open service tickets.
- A portfolio visualization, such as a geographic map or sortable property list.
Example KPIs
- Total properties: 35.
- Properties requiring attention: 6.
- Critical incidents: 3.
- Open tickets: 22.
- Offline devices: 8.
- Active visitors: 148.
Required interactions
- Select a property.
- Filter by region.
- Filter by operational status.
- Open a critical incident.
- Navigate to a ticket.
- Open the property detail page.
- Switch between summary and detailed portfolio views.
UX requirement
Design this screen so the regional manager can answer three questions within five seconds:
- Is my portfolio operating normally?
- Which properties need attention?
- What should I do first?
Include a short annotation describing the dashboard's information hierarchy.
B. Property Detail / Drilldown
Primary personas: Regional Property Manager and Front Desk Employee
Create a dedicated view for an individual building.
Required sections
- Property name and operational status.
- Building context and local time.
- Critical issues.
- Today's visitors.
- Access activity.
- Video/security incidents.
- Device health.
- Open service tickets.
- Building activity timeline.
- Building-specific navigation.
Required interactions
- Switch properties.
- Review an alert.
- Open visitor management.
- View access events.
- Open device inventory.
- Create a service ticket.
Create two variations:
Regional manager view: More oversight, cross-property context, and escalation options.
Front desk view: Simplified navigation, building-specific information, and emphasis on immediate visitor and access tasks.
Use shared components whenever possible. Do not create two unrelated design systems.
C. Incident and Alert Triage
Create an incident-management workflow.
Screens
- Incident inbox / alert list.
- Incident detail.
- Incident investigation or review.
- Incident action / assignment.
- Resolution and confirmation.
Incident example
An exterior door at Riverside Commons has been held open for six minutes outside approved operating hours.
The incident should display:
- Severity.
- Incident status.
- Property.
- Location.
- Time detected.
- Event description.
- Related device.
- Available evidence.
- Activity history.
- Assigned owner.
- Recommended next action.
Available actions
- Acknowledge.
- Assign to a team member.
- Review associated camera evidence.
- Create a service ticket.
- Escalate.
- Resolve.
Clearly distinguish an incident being acknowledged from being resolved.
Include states for in-progress actions, action failure, and insufficient permissions.
Annotate the points at which a destructive, security-sensitive, or high-impact action requires confirmation.
D. Visitor Management
Create an end-to-end visitor-management workflow.
Screens
- Visitor directory / today's visits.
- Visitor detail.
- New visitor registration.
- Visitor check-in.
- Check-in success.
- Visitor check-out state.
Required functionality
- Search visitors.
- Filter by visit status.
- Register a new visitor.
- Select a host.
- Select visit date/time.
- Select property.
- Check a visitor in.
- Check a visitor out.
- View visit history.
- Handle a visitor without preregistration.
Consider interactions involving badges, host notifications, and visitor approval.
Include a simple front-desk-first workflow with minimal cognitive overhead.
E. Access Control — Users and Credentials
Create the workflow for managing user access.
Screens
- User/access directory.
- User detail.
- Credential management.
- Add or edit credential.
- Assign access permissions.
- Suspend or revoke credential confirmation.
Required functionality
- Search users.
- Filter by credential status.
- View assigned properties.
- View active credentials.
- Assign a credential.
- Change access permissions.
- Temporarily suspend access.
- Revoke a credential.
- Review the action history.
Support users who have access to more than one property.
Clearly distinguish between adding access, modifying access, suspending access, and permanently revoking credentials.
Security-sensitive operations must provide clear scope, confirmation, and feedback.
F. Device Status and Health
Create a device-monitoring workflow.
Screens
- Device inventory.
- Device detail.
- Offline device investigation.
- Maintenance state.
- Service ticket creation from a device.
Device types
- Access readers.
- Door controllers.
- Security cameras.
- Intercoms.
- Network gateways.
Required attributes
- Device name.
- Type.
- Property.
- Location.
- Health status.
- Connection status.
- Last seen.
- Maintenance status.
- Related incidents.
- Related tickets.
Device statuses
- Online.
- Offline.
- Degraded.
- Maintenance.
- Unknown.
Device status must be understandable to nontechnical property managers.
For an offline device, include a clear explanation of operational impact and recommended next steps.
G. Service Ticket Handoff and Escalation
Create a complete service-management workflow.
Screens
- Ticket directory.
- Ticket detail.
- New ticket.
- Assign or hand off ticket.
- Escalate ticket.
- Confirmation / updated ticket state.
Required functionality
- Create from scratch.
- Create from an incident.
- Create from a device.
- Assign team or owner.
- Set priority.
- Add notes.
- Update status.
- Escalate unresolved issues.
- Review activity history.
Ticket statuses
- New.
- Assigned.
- In progress.
- Waiting.
- Escalated.
- Resolved.
- Closed.
The ticket workflow must preserve links to the original incident or device.
H. Search and Global Navigation
Create the application's navigation system.
Required elements
- Persistent desktop sidebar.
- Global search.
- Property selector.
- User profile / role information.
- Notifications.
- Breadcrumbs.
- Contextual page actions.
Search behavior
Search must support:
- Properties.
- Visitors.
- Users.
- Incidents.
- Service tickets.
- Devices.
Create wireframes for:
- Global search closed.
- Search open with suggestions.
- Search results grouped by content type.
- No results.
- Results filtered to a specific property.
Make it clear which entity the user is selecting and where it will navigate.
Define how property context is preserved or changed when navigating from search.
I. Advanced Data Table
Create one robust data-table pattern that can be reused throughout the application.
The incident directory will be the primary reference.
Required functionality
- Column sorting.
- Multi-condition filtering.
- Text search.
- Column visibility.
- Column resizing or documented resize behavior.
- Row selection.
- Bulk actions.
- Saved views.
- Pagination or virtualization.
- Sticky table headers.
- Row-level actions.
- Clear filter/reset behavior.
Create these variants
- Default table.
- Filtered table.
- Sorted table.
- Column configuration.
- Multiple rows selected.
- Bulk-action confirmation.
- Saved-view selection.
- High-density table with 300+ incidents.
- Multi-property filtered table.
For the 300+ incident state, use realistic result counts and a small representative set of visible rows. Do not manually create hundreds of individual rows.
Include a selection state that distinguishes:
- Selected rows on the current page.
- All matching results across multiple pages.
Define how sorting, filtering, and selection affect one another.
6. States and edge cases
Build a dedicated page showing reusable interaction and system states.
Each state should appear within a realistic application context rather than as an isolated decorative example.
Required states
1. Empty state
Example: No incidents match the selected filters.
Provide a clear explanation and relevant next action.
2. Loading state
Show page loading, table loading, and individual component loading.
Identify where skeletons versus loading indicators are appropriate.
3. Offline / stale data
Show an interface where operational data has not refreshed.
Include:
- Last successful update.
- Connection status.
- Refresh action.
- Clear distinction between stale information and confirmed live status.
4. Permission denied
Show a front-desk employee attempting an unauthorized action.
Explain the limitation without exposing restricted information.
5. Destructive-action confirmation
Show confirmation for credential revocation or another security-sensitive action.
Include scope, consequence, and cancellation.
6. Partial failure
Example: A ticket was created, but the linked incident failed to update.
Show which actions succeeded, which failed, and what the user can do next.
7. High-density data
Show 300+ incidents and advanced filtering.
8. Multi-property selection
Show a manager selecting several properties, including multiple cities or regions.
Make the aggregation scope obvious.
9. Device offline / maintenance
Show operational impact, status history, and escalation path.
10. Responsive critical actions
Show a user acknowledging or escalating an incident from a mobile device.
Additional component states
Where applicable, define:
- Default.
- Hover.
- Focus-visible.
- Active/selected.
- Disabled.
- Loading.
- Error.
- Success.
- Read-only.
Use component variants rather than creating unrelated objects.
7. Component library
Create a low-fidelity Figma component library of approximately 28 reusable components.
Prioritize the following:
Foundations and navigation
- Button.
- Icon button.
- Text input.
- Search input.
- Select / dropdown.
- Checkbox.
- Radio button.
- Toggle / switch.
- Sidebar navigation item.
- Tabs.
- Breadcrumbs.
Information display
- KPI / metric card.
- Status badge.
- Severity badge.
- Alert banner.
- Property summary card.
- Activity timeline item.
- User / entity avatar.
- Tooltip.
Data management
- Table / table row system.
- Filter chip.
- Saved-view control.
- Pagination.
- Bulk-action toolbar.
Feedback and overlays
- Modal / confirmation dialog.
- Drawer / side panel.
- Toast / notification.
- Empty/loading/error state container.
Use nested components or documented patterns for smaller supporting elements such as table cells, labels, skeletons, and form-field help text.
Component requirements
Use Figma component properties, variants, and Auto Layout wherever supported.
Apply consistent naming conventions.
Example:
Button / Primary / Default
Button / Primary / Disabled
Status Badge / Offline
Table Row / Selected
Alert Banner / Warning
Identify relevant properties such as:
- Size.
- Variant.
- State.
- Icon visibility.
- Content.
- Severity.
- Selection status.
Document where a component is reused and which design tokens it consumes.
8. Design token discovery
This is one of the most important project deliverables.
The purpose is to discover which tokens Atlas Ops needs, not to finalize its visual identity.
Create a preliminary token architecture using reusable Figma Variables and Styles wherever available.
Use semantic naming conventions so values can be modified later without restructuring the design system.
A. Typography tokens
Identify typography roles required across all screens.
Include:
- Display / page title.
- Section heading.
- Card heading.
- Body large.
- Body default.
- Body small.
- Label.
- Caption.
- Table header.
- Table cell.
- Metric / KPI.
- Button.
- Helper text.
Recommend a practical typography scale and create corresponding text styles.
Use a neutral placeholder typeface initially.
B. Color tokens
Do not invent a final brand palette.
Instead, establish semantic color roles using grayscale placeholders.
Required categories:
- Background / canvas.
- Surface / default.
- Surface / elevated.
- Surface / muted.
- Text / primary.
- Text / secondary.
- Text / disabled.
- Border / default.
- Border / strong.
- Action / primary.
- Action / hover.
- Action / disabled.
- Focus / ring.
- Status / success.
- Status / warning.
- Status / critical.
- Status / info.
- Status / offline.
- Status / maintenance.
Status placeholders must include explicit text labels, since the real semantic colors have not been selected.
C. Spacing tokens
Start with a 4px-based spacing system.
Suggested initial values:
4, 8, 12, 16, 20, 24, 32, 40, 48, and 64px.
Apply them consistently to:
- Component padding.
- Card padding.
- Layout gutters.
- Section separation.
- Form-field spacing.
- Table row spacing.
- Navigation spacing.
Use token references instead of unexplained one-off values.
D. Elevation and surface tokens
Define preliminary tokens for:
- Flat surfaces.
- Raised cards.
- Dropdowns.
- Drawers.
- Modals.
- Sticky navigation.
Keep actual shadow styling minimal at this stage.
E. Border and radius tokens
Document:
- Border widths.
- Divider styles.
- Card radius.
- Input radius.
- Button radius.
- Modal radius.
F. Sizing and density tokens
Identify additional tokens for:
- Button heights.
- Input heights.
- Table row heights.
- Sidebar width.
- Header height.
- Icon sizes.
- Avatar sizes.
- Touch targets.
- Compact versus comfortable density.
G. Token architecture
Use three levels where appropriate:
Primitive → Semantic → Component
Example:
space.4 → spacing.control.default → button.padding.inline
Or:
neutral.100 → surface.default → card.background
Preserve the conceptual hierarchy even if Figma's available tools cannot implement variable aliasing.
H. Token documentation
Create a token inventory table with:
| Token name | Category | Placeholder value | Used by | Purpose | Open design decision |
|---|---|---|---|---|---|
Distinguish between:
- Required tokens.
- Recommended tokens.
- Optional future tokens.
Do not introduce tokens simply to make the library appear comprehensive.
Document any recurring layout or visual values that should become tokens.
9. Accessibility requirements
Add accessibility annotations alongside the relevant screens and components.
Include:
- Semantic heading hierarchy.
- Keyboard navigation.
- Visible keyboard focus.
- Logical tab order.
- Clear form labels.
- Form error identification.
- Accessible button names.
- Dialog focus behavior.
- Table header relationships.
- Screen-reader status announcements.
- Status communication beyond color.
- Loading and error announcements.
- Minimum touch targets.
- Clear, descriptive action labels.
Flag text and UI regions that will require WCAG 2.2 AA contrast validation when final colors are selected.
Do not claim contrast compliance using unfinished grayscale placeholders.
Pay particular attention to incidents, permissions, credential changes, and destructive actions.
10. Responsive design
Create responsive variations for the most important workflows.
Tablet — 1024px
Create:
- Portfolio overview.
- Property detail.
- Visitor check-in.
- Incident triage.
Consider:
- Collapsible navigation.
- Responsive tables.
- Adaptable card layouts.
- Touch interaction.
- Readable status displays.
Mobile — 390px
Prioritize essential operational tasks rather than recreating the entire desktop dashboard.
Create:
- Critical alerts list.
- Incident detail.
- Acknowledge / escalate action.
- Visitor lookup or check-in.
- Offline or failed-action feedback.
Optimize for fast decision-making, clear primary actions, and safe interaction.
Annotate how desktop components adapt into mobile patterns.
11. Clickable prototype
Create a navigable prototype connecting the major workflows.
Prioritize these scenarios:
Scenario 1 — Regional Manager
Portfolio Dashboard → Critical Incident → Incident Detail → Assign / Escalate → Confirmation.
Scenario 2 — Front Desk Employee
Property Dashboard → Visitors → Visitor Lookup → Check-in → Success.
Scenario 3 — Access Management
User Directory → User Detail → Credentials → Revoke → Confirmation.
Scenario 4 — Device Failure
Property Detail → Offline Device → Device Detail → Create Ticket → Assign.
Scenario 5 — Advanced Table
Incident Directory → Apply Filters → Select Multiple Rows → Bulk Action → Confirmation.
Scenario 6 — Search
Global Search → Select Result → Open Entity Detail.
Where supported, connect:
- Buttons.
- Navigation items.
- Tabs.
- Table rows.
- Drawers.
- Modals.
- Confirmation actions.
- Back navigation.
Clearly mark interactions that are illustrative only and not backed by a real service.
Use prototype navigation and state changes to demonstrate the UX, not to simulate real-world security-system operations.
12. Product architecture and validation
On the Product Architecture page, include:
A. Sitemap
Show the primary navigation hierarchy and the relationship between:
- Portfolio.
- Properties.
- Incidents.
- Visitors.
- Access.
- Devices.
- Service tickets.
- Activity.
- Search.
B. Core user-flow diagrams
Create concise flow diagrams showing decisions and key paths.
C. Role and permission matrix
Compare what regional managers and front-desk employees can:
- View.
- Create.
- Edit.
- Assign.
- Escalate.
- Resolve.
- Revoke.
Treat permission definitions as design assumptions that require product/security validation.
D. UX assumptions
Clearly identify decisions based on assumptions rather than validated requirements.
E. Validation checklist
Evaluate the design against these questions:
- Can a regional manager identify the most urgent issue quickly?
- Can a front-desk employee check in a visitor efficiently?
- Can users distinguish between alerts, incidents, and tickets?
- Can users tell which property they are operating in?
- Can users identify whether displayed data is current?
- Can users understand the consequence of a security-sensitive action?
- Does the interface remain usable with hundreds of incidents?
- Do component patterns remain consistent across modules?
- Can the same system support desktop, tablet, and critical mobile actions?
13. Build sequence
Work in the following order.
Phase 1 — Architecture
- Create the Figma pages.
- Establish the sitemap.
- Define the two user modes.
- Establish shared application layouts.
- Map core workflows.
Phase 2 — Foundations
- Define preliminary token categories.
- Create initial variables and text styles.
- Build the 28-component library.
- Establish variant naming conventions.
- Create basic layout templates.
Phase 3 — Wireframes
- Build the portfolio dashboard.
- Build property detail.
- Build the remaining core workflows.
- Reuse component instances.
- Maintain consistent application structure.
Phase 4 — States and responsive
- Add key interaction states.
- Add error and edge-case variations.
- Create high-density data examples.
- Build tablet and mobile frames.
Phase 5 — Prototype and audit
- Connect primary user journeys.
- Add accessibility annotations.
- Review component consistency.
- Identify missing components.
- Audit design token usage.
- Summarize unresolved product and design decisions.
Do not stop after producing a plan. Execute the build using the available Figma tools.
If tool limits prevent completing the entire scope, prioritize editable foundations and the primary end-to-end flows, report exactly what was built, and identify incomplete work. Do not claim that uncreated frames or interactions exist.
14. Definition of done
The project should result in:
- An organized Figma file with the requested sections.
- A documented information architecture.
- Both regional-manager and front-desk experiences.
- Low-fidelity wireframes covering all nine core product flows.
- Reusable patterns for the ten required edge-case categories.
- Approximately 28 documented reusable components.
- Preliminary design token definitions.
- Component variants and interaction states.
- Accessibility annotations.
- Desktop, tablet, and critical-action mobile layouts.
- Connected prototype flows.
- A final design-token discovery audit.
Do not consider the project complete just because the main dashboard looks finished.
The goal is an interconnected product skeleton that exposes all major design-system needs.
15. Final deliverable: Design System Discovery Report
After building the wireframes, provide a concise report answering:
1. What are the most frequently reused components?
List the components and the primary screens that use them.
2. Which design tokens are essential?
Organize recommendations by typography, color, spacing, surface, elevation, border, radius, sizing, and status.
3. Which components require the most variants?
Highlight complex components such as tables, inputs, buttons, navigation, and status indicators.
4. Which UX patterns create the greatest design complexity?
Consider data density, role permissions, multi-property context, real-time alerts, and service handoffs.
5. What is missing from the initial design system?
Identify gaps revealed by the wireframes.
6. Which design decisions should be made before high-fidelity design?
Provide a prioritized decision list.
7. What should be tested with real users?
Recommend usability tests for both primary personas.
8. Which Figma pages, frames, components, variables, and prototype interactions were actually created?
Provide a completion summary and the Figma file link if available.
The final result should give me a strong foundation for developing the Atlas Ops visual design system without needing to restructure the product's layouts or components later.
Build this in phases if the Figma integration struggles with the full prompt. Begin with the architecture, foundations, components, portfolio dashboard, and incident workflow. Once those establish the patterns, the remaining pages should reuse them instead of introducing inconsistent UI.
Start building the Figma file now.
Prompt I gave to claude
Claude generated figma boards
Challenging the Initial Design
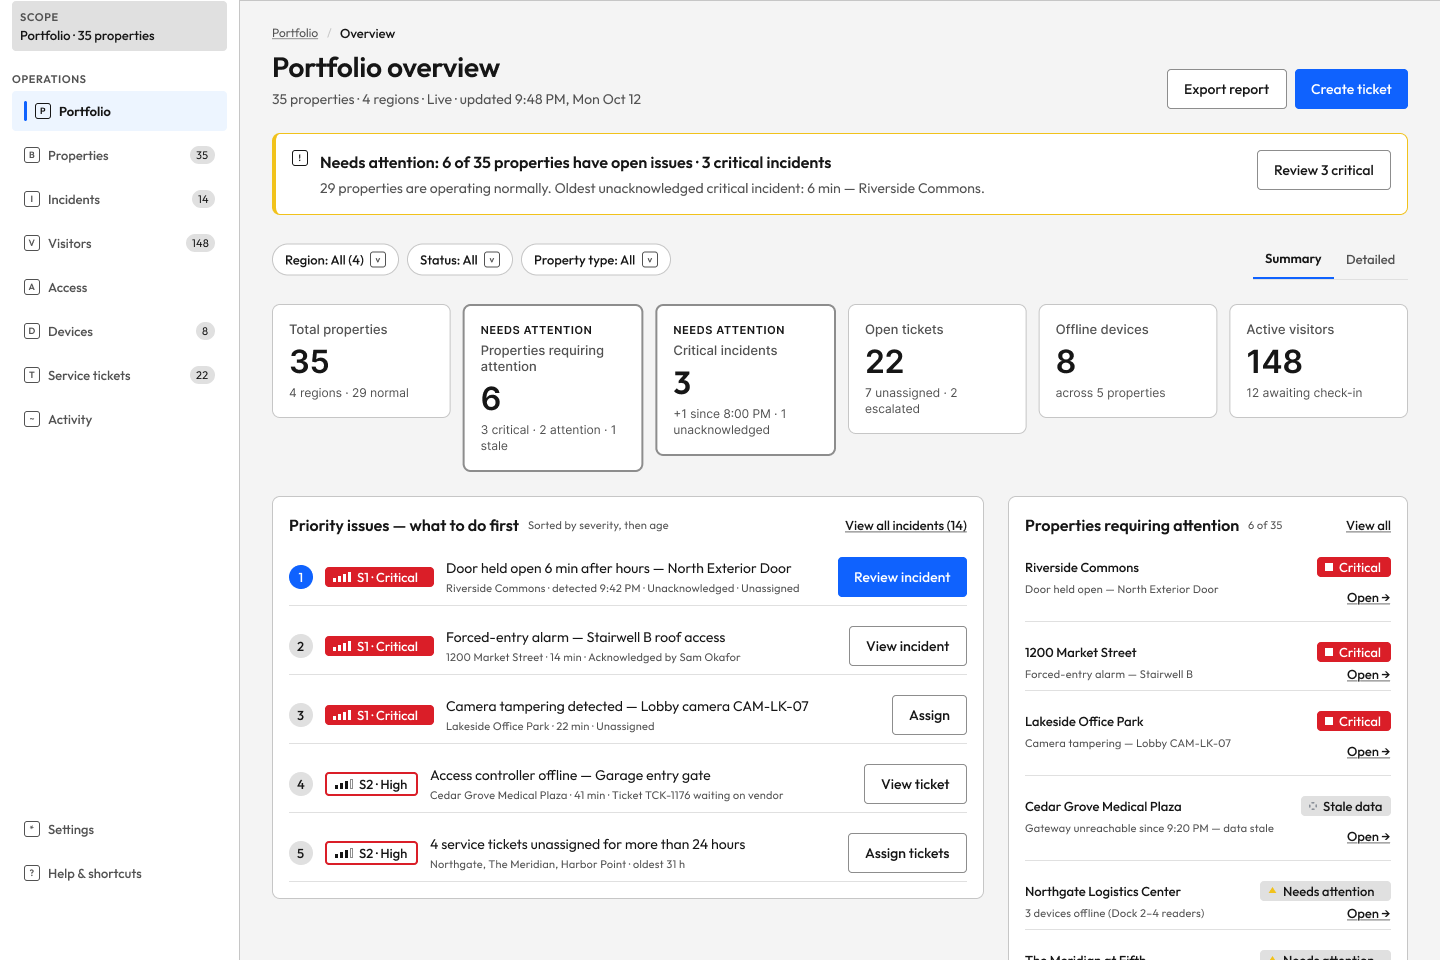
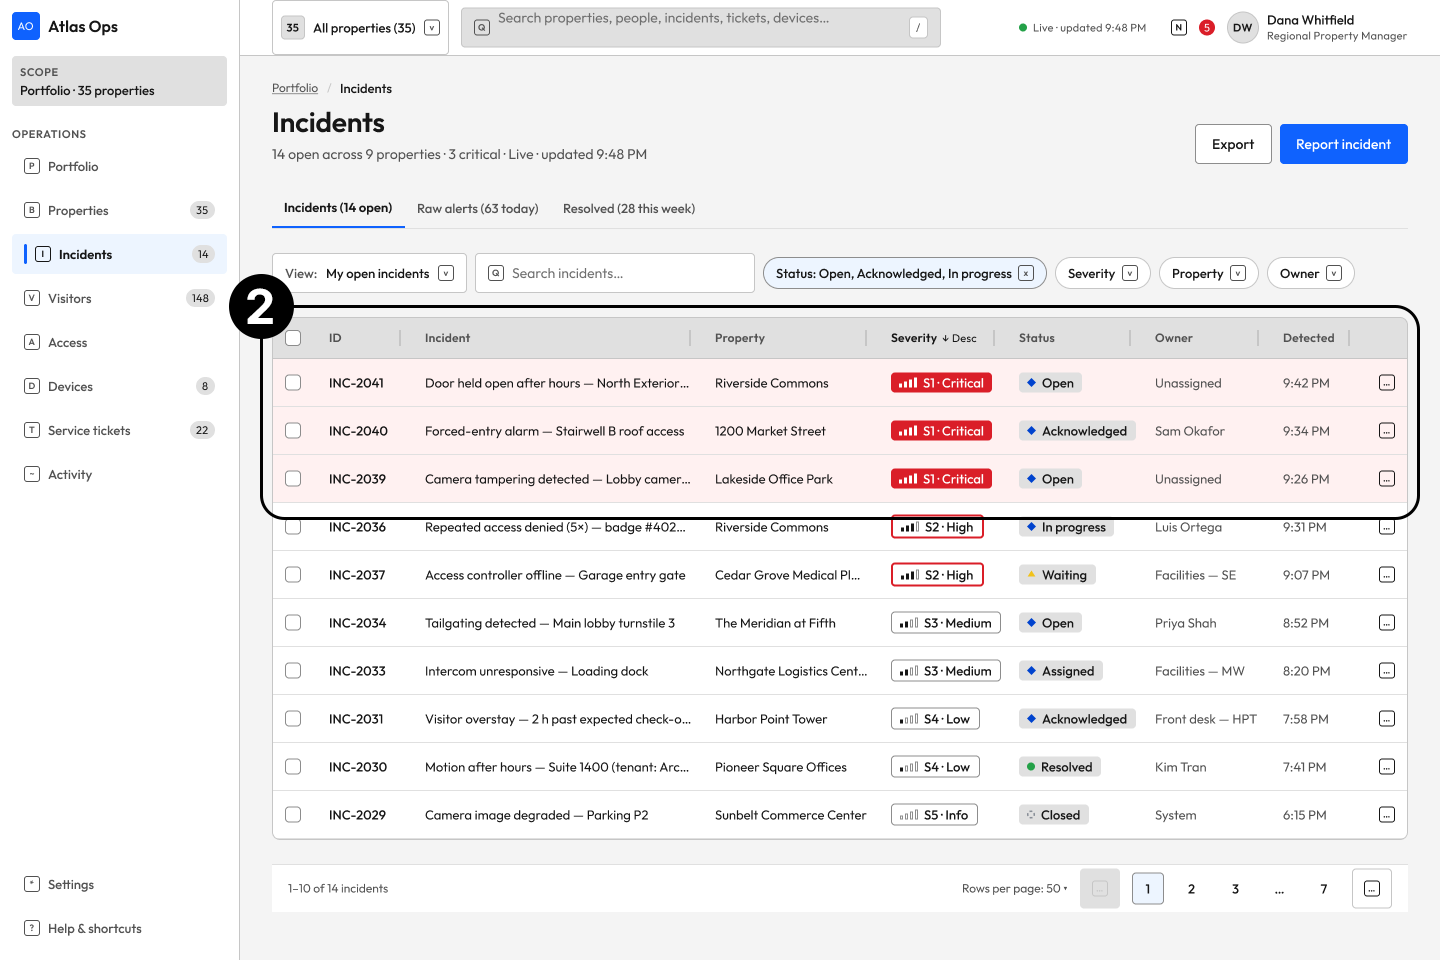
Claude's initial design consolidated information from multiple systems into a shared interface. However, when I evaluated the screens against the project's design objectives, I identified several areas where the experience fell short.
While the interface presented the necessary operational information, it didn't always make that information easy to prioritize or act on. I focused my evaluation on information hierarchy, workflow continuity, navigation, and visual communication to identify opportunities for improvement.
Problem
The initial portfolio dashboard presented too much operational information without a clear hierarchy, making critical incidents difficult to distinguish from routine activity.
Design direction
Prioritize critical incidents and actionable information while keeping secondary data accessible.
Problem
The interface surfaced operational issues but lacked a clear path from identifying an incident to investigating and taking action.
Design direction
Create a connected workflow from incident discovery to investigation, assignment, and resolution.
Problem
The interface relied heavily on red across multiple elements, reducing its effectiveness in communicating urgency and severity.
Design direction
Reserve red for critical states and establish a clearer hierarchy using semantic status colors.
Initial AI-generated design
Initial AI-generated design
Initial AI-generated design
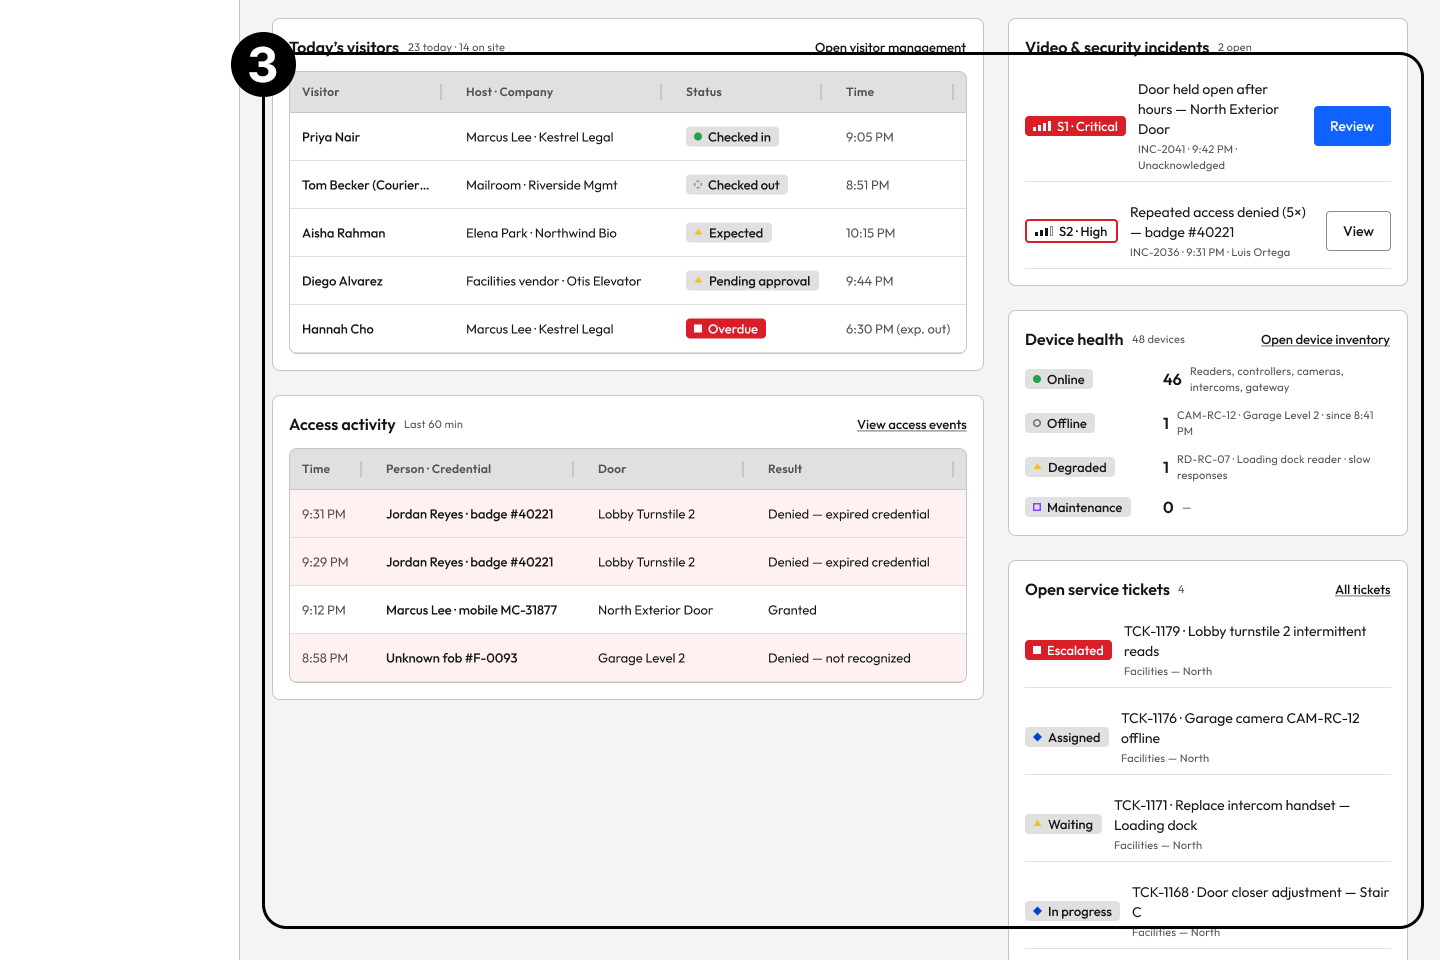
These issues directly conflicted with two of the project's primary design objectives: providing clear visibility into operational health and helping users quickly identify and act on high-priority issues.
The evaluation revealed that consolidating multiple systems into one interface was only part of the solution. The larger design challenge was transforming that information into a clear, prioritized, and actionable experience.
These findings became the foundation for my next iteration, where I took a more hands-on approach to refining the information architecture, incident workflows, and visual hierarchy.
Redesigning Around Decisions,
Not Just Data
After evaluating Claude’s initial output and identifying opportunities for improvement, I went and refined the experience. I reorganized the information hierarchy, refined UI components, and developed more intentional workflows to better align the platform with its core design objectives.
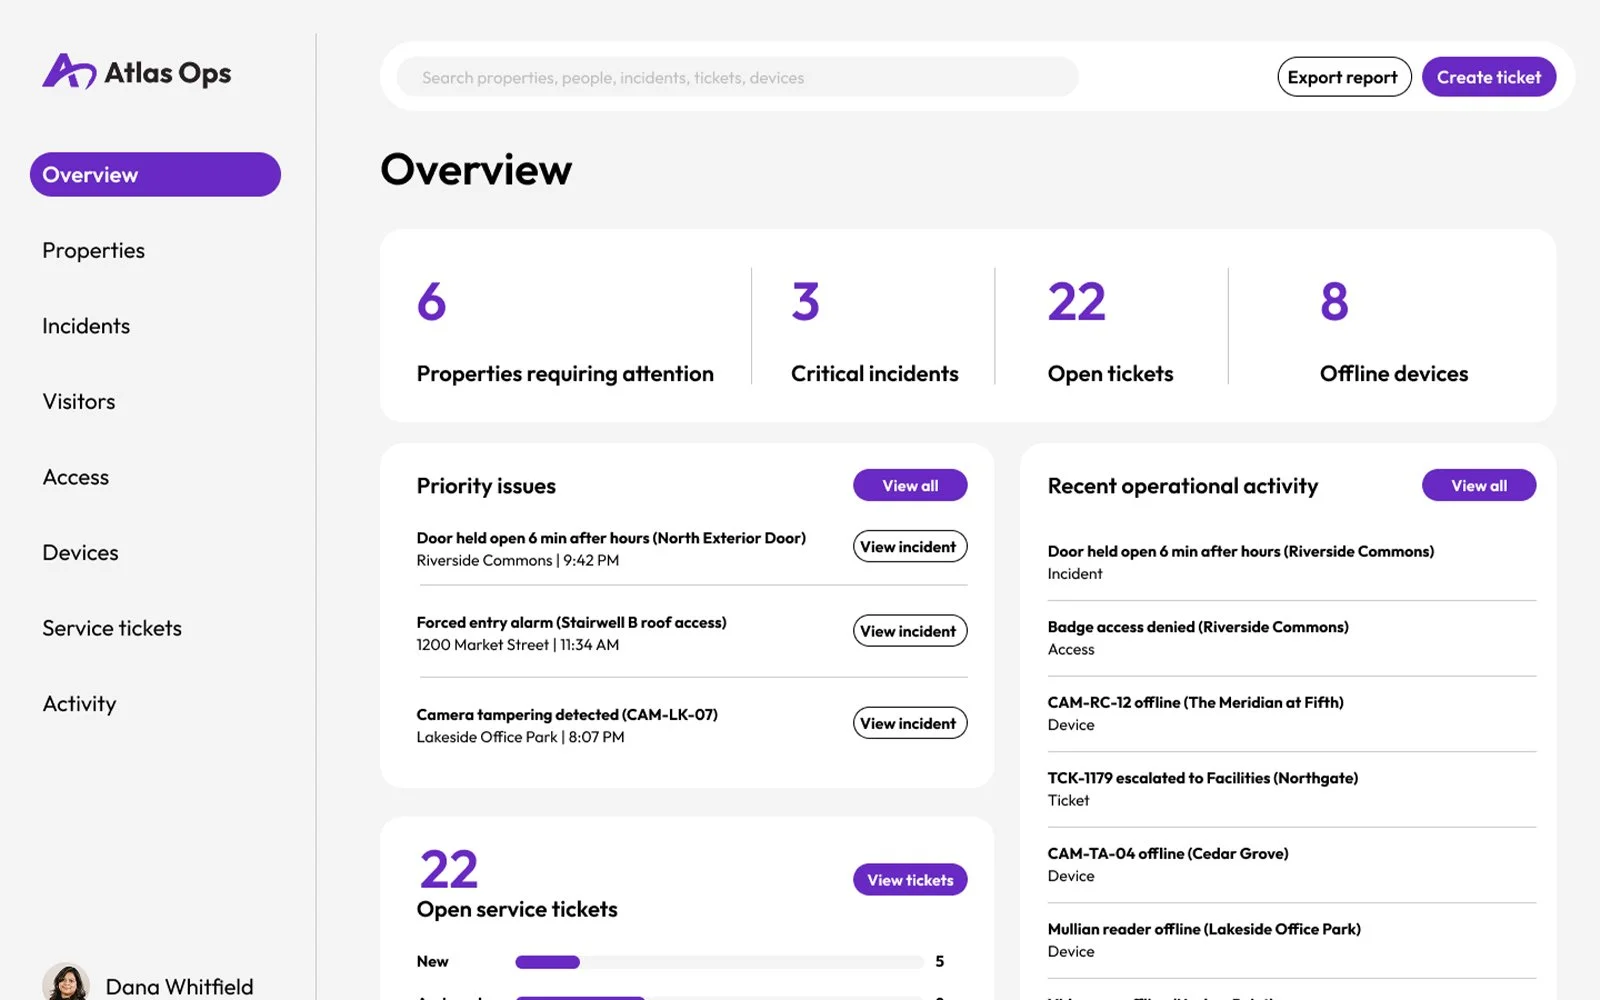
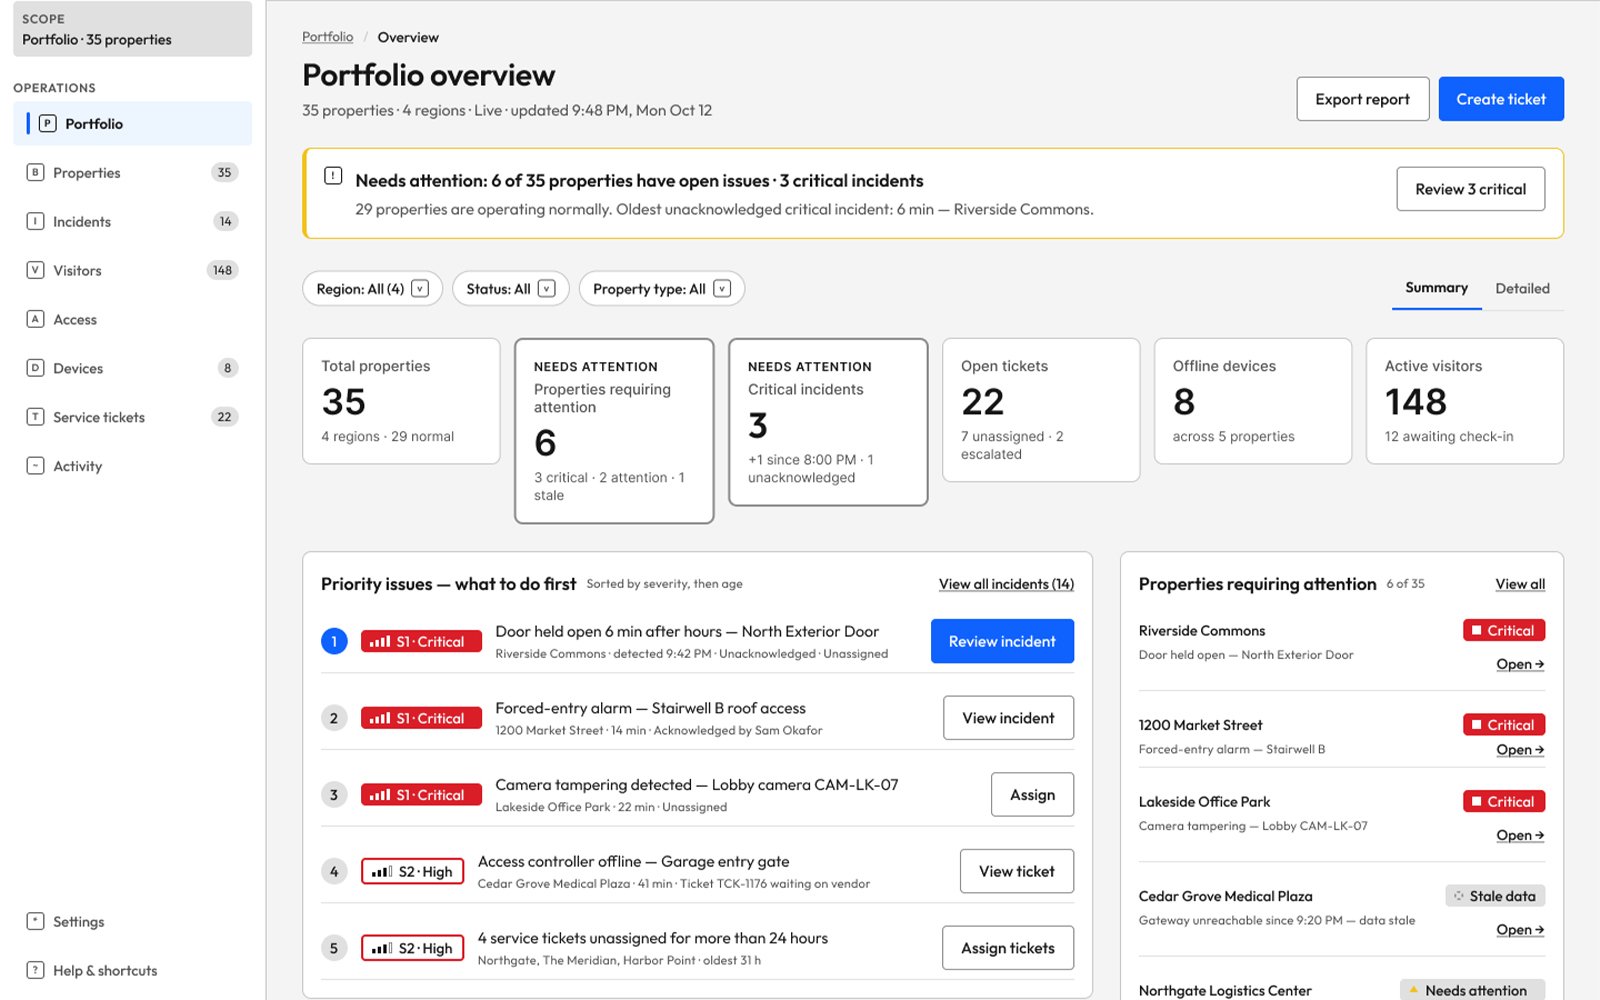
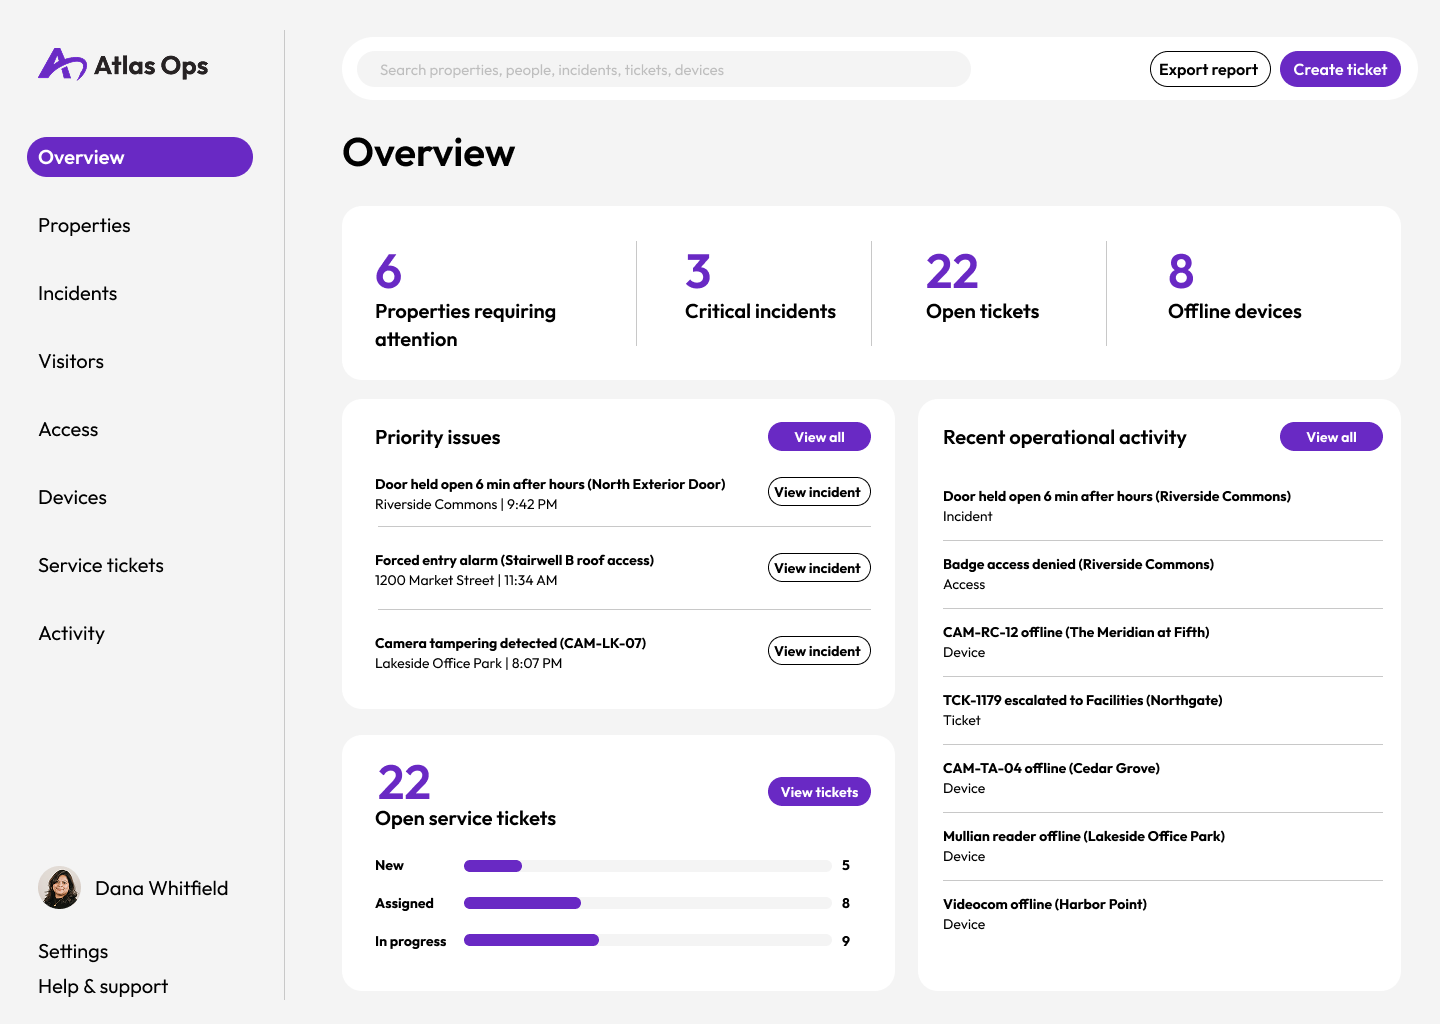
Priority-Focused Dashboard Redesigned the dashboard to reduce visual clutter, establish a clearer information hierarchy, and surface critical information first, helping property managers quickly identify priorities and take action.
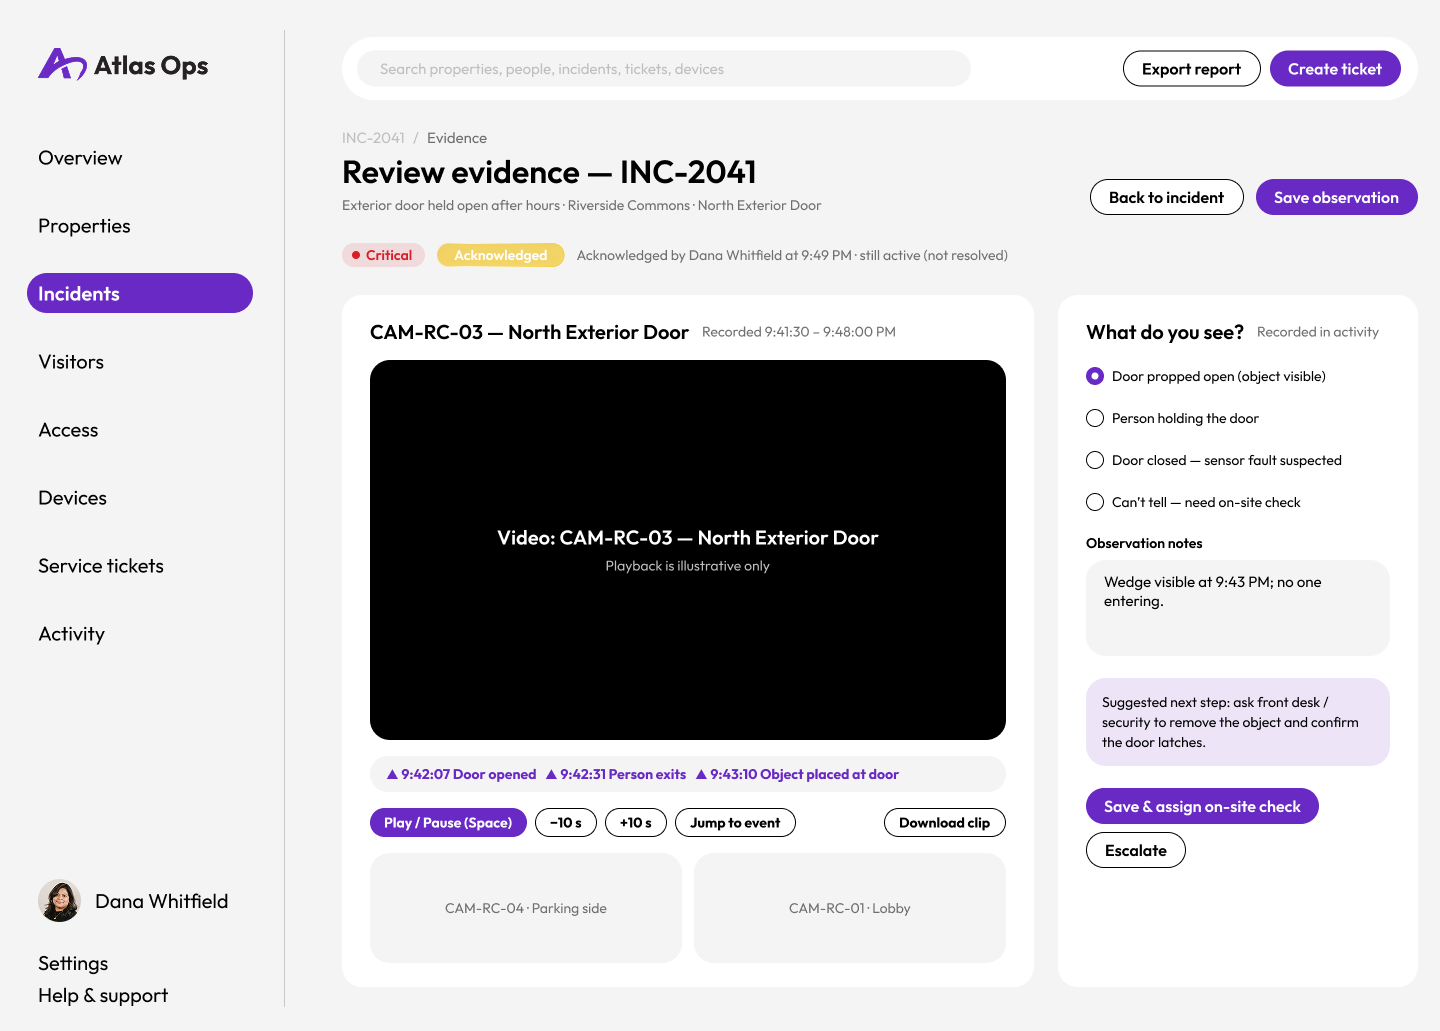
Streamlined Incident WorkflowsRestructured the incident management experience to create a more intuitive workflow, guiding property managers from incident discovery and investigation through assignment and resolution with clear, actionable next steps.
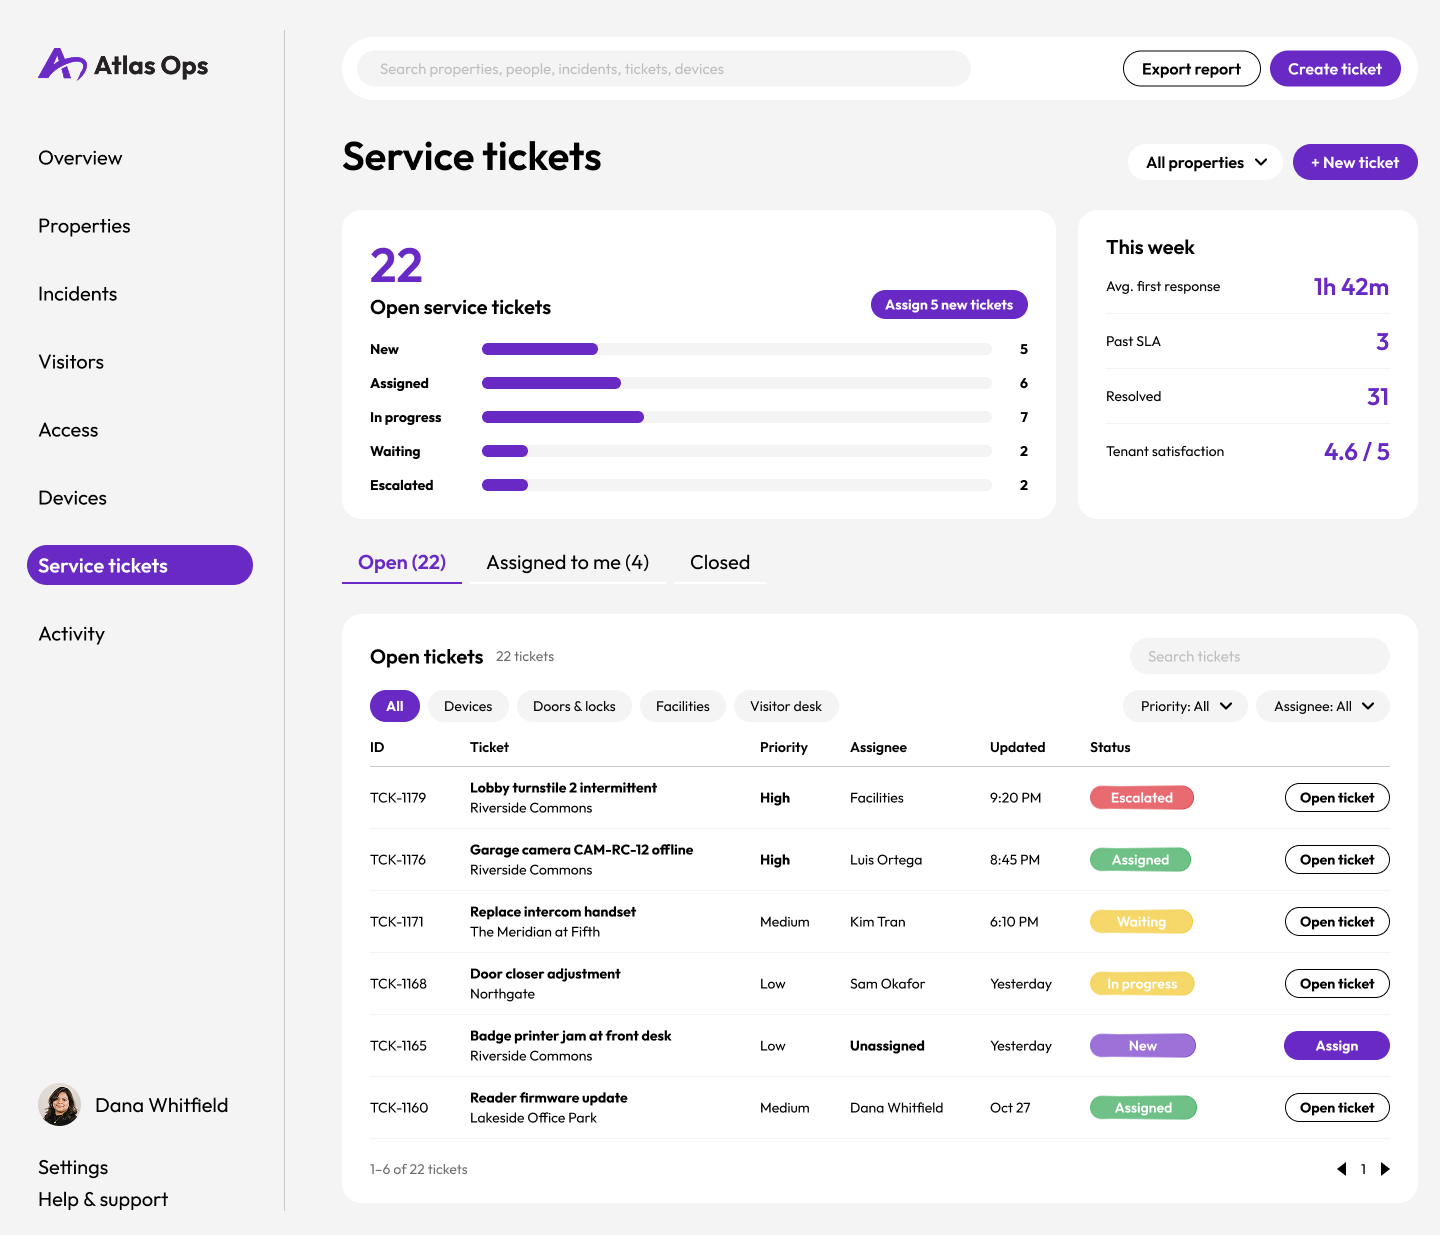
Purposeful Color SystemRefined the color palette to reduce visual noise and give color a more intentional role in the interface. Reserved prominent colors for critical alerts, status changes, and items requiring attention, making important information easier to recognize at a glance.
Outcome
Atlas Ops resulted in a more focused property management interface that prioritizes clarity, actionable information, and streamlined workflows. By critically evaluating Claude's initial concepts, I identified opportunities to improve information hierarchy, simplify visual communication, and restructure incident management around the decisions property managers need to make.
The project demonstrates how AI can accelerate early design exploration while reinforcing the importance of human judgment in shaping functional, intentional product experiences. Rather than treating AI-generated designs as finished solutions, I used them as a starting point for deliberate product design decisions.